

Gallery
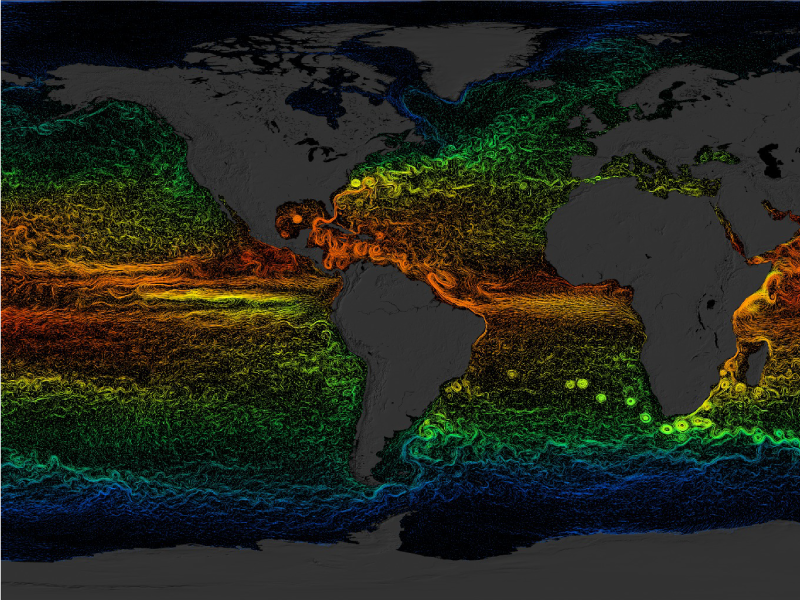
Global sea surface currents colored by temperature. Credit: NASA/Goddard Space Flight Center Scientific Visualization Studio (MP4, 42.1 MB).
Global sea surface currents colored by temperature. Credit: NASA/Goddard Space Flight Center Scientific Visualization Studio (MP4, 42.1 MB).
Global Sea Surface Currents and Temperature
[15-Feb-2012] This visualization shows sea surface current flows. The flows are colored by corresponding sea surface temperature data. This visualization is rendered for display on very high resolution devices like hyperwalls or for print media. This visualization was produced using model output from the joint MIT/JPL project entitled Estimating the Circulation and Climate of the Ocean, Phase II (ECCO2). ECCO2 uses the MIT general circulation model (MITgcm) to synthesize satellite and in-situ data of the global ocean and sea-ice at resolutions that begin to resolve ocean eddies and other narrow current systems, which transport heat and carbon in the oceans. The ECCO2 model simulates ocean flows at all depths, but only surface flows are used in this visualization.Original Media » Click on the image to play the movie. Click on the Escape key or anywhere outside the shadowbox to close.
To download a copy, right click on the image and select Download Linked File (on a Mac keyboard, click the touchpad while holding down the Control key).