
Gallery
Sea Surface Height Grids with Different Spatial Resolutions
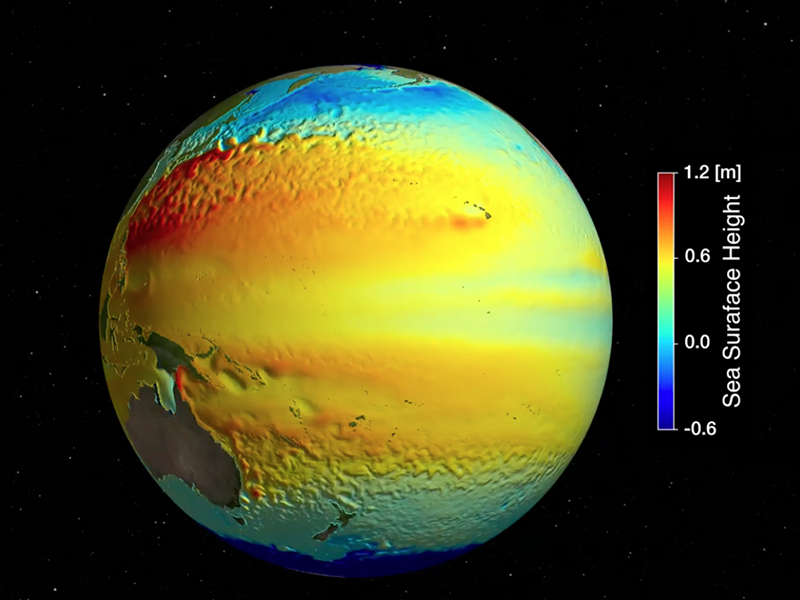
[26-Oct-2022] This animation illustrates the evolution of the spatial resolution in the global gridded SSH maps using the ECCO 1/12-deg simulation daily SSH maps. Particularly, the animation visualizes the SSH maps at spatial resolutions ranging from 3 to 2 to 1 degree to 15 km (the expected resolution of SWOT observations). Blue patterns show regions of low sea surface height, while the red patterns show regions of high sea surface height. Small scale features such as fronts, meanders and eddies in the Gulf Stream, California Current, or Agulhas Current regions that are not captured at resolutions higher than 1 degree become visible in the 15-km resolution maps. It clearly illustrates the dramatic increase in observability of small-scale ocean circulation. The data can be accessed from the PO.DAAC Portal at SWOT Simulated Level-2 KaRIn SSH from MITgcm ECCO LLC4320 for Science Version 1 (DOI: 10.5067/KARIN-2MES1).Related Data in Action page can be referenced here: Data in Action: Sea Surface Height grids with different spatial resolutions.
Watch video on the PO.DAAC website.Original Media »
Click on the image to play the movie. Click on the Escape key or anywhere outside the shadowbox to close.